Silver Price
Among the ancients, silver came second only to gold in terms of beauty, value, and importance. Gold has been valued for thousands of years and is a more expensive option. If you’re on a budget or new to precious metal investing, silver may be a better choice.
Silver has been used and valued for thousands of years, and it has functioned as currency, ornamentation, and material for various implements and tools.
But it was the Romans who really took to the use of silver. Their miners were so efficient that they produced a peak of 200 tons per year, and their economy circulated as much as 10,000 tons by the middle of the 2nd century AD. That’s about 5–10 times as much silver as the amount that circulated in medieval Europe and the Caliphate in 800 AD.
And yet, today, we still use it. It’s easy to see why, because modern science has discovered properties beyond rarity and beauty. Among metals, it is the most ductile, which means it’s the easiest to draw into very thin wires. It is also the most malleable of metals, and that means it is not difficult at all to hammer the metal into thin sheets. And it conducts electricity and heat better than all the other elements. It even reflects light very well, and it doesn’t readily react to many compounds, including water and acids. Since silver has many industrial uses in addition to its value as a precious metal, it may be more stable in times of economic downturn.
Below is the historical Silver price per troy oz.
| Year | Price | Price (Inflation Adjusted) | Change |
|---|---|---|---|
| 1792 | $1.293 | $65.36 | 0% |
| 1793 | $1.293 | $63.16 | 0% |
| 1794 | $1.293 | $56.95 | 0% |
| 1795 | $1.293 | $49.78 | 0% |
| 1796 | $1.293 | $47.28 | 0% |
| 1797 | $1.293 | $49.13 | 0% |
| 1798 | $1.293 | $50.79 | 0% |
| 1799 | $1.293 | $50.79 | 0% |
| 1800 | $1.293 | $49.78 | 0% |
| 1801 | $1.293 | $49.13 | 0% |
| 1802 | $1.293 | $58.27 | 0% |
| 1803 | $1.293 | $55.27 | 0% |
| 1804 | $1.293 | $52.94 | 0% |
| 1805 | $1.293 | $53.31 | 0% |
| 1806 | $1.293 | $51.13 | 0% |
| 1807 | $1.293 | $54.07 | 0% |
| 1808 | $1.293 | $49.78 | 0% |
| 1809 | $1.293 | $50.79 | 0% |
| 1810 | $1.293 | $50.79 | 0% |
| 1811 | $1.293 | $47.57 | 0% |
| 1812 | $1.293 | $46.98 | 0% |
| 1813 | $1.293 | $39.15 | 0% |
| 1814 | $1.453 | $40.03 | 11% |
| 1815 | $1.477 | $46.41 | 2% |
| 1816 | $1.323 | $45.50 | -12% |
| 1817 | $1.293 | $46.98 | -2% |
| 1818 | $1.293 | $49.13 | 0% |
| 1819 | $1.293 | $49.13 | 0% |
| 1820 | $1.293 | $53.31 | 0% |
| 1821 | $1.293 | $55.88 | 0% |
| 1822 | $1.293 | $54.14 | 0% |
| 1823 | $1.293 | $56.80 | 0% |
| 1824 | $1.293 | $60.79 | 0% |
| 1825 | $1.293 | $59.73 | 0% |
| 1826 | $1.293 | $62.99 | 0% |
| 1827 | $1.293 | $60.79 | 0% |
| 1828 | $1.293 | $60.79 | 0% |
| 1829 | $1.293 | $59.73 | 0% |
| 1830 | $1.293 | $64.16 | 0% |
| 1831 | $1.293 | $61.87 | 0% |
| 1832 | $1.293 | $60.78 | 0% |
| 1833 | $1.293 | $59.73 | 0% |
| 1834 | $1.293 | $67.93 | 0% |
| 1835 | $1.293 | $57.75 | 0% |
| 1836 | $1.293 | $50.95 | 0% |
| 1837 | $1.350 | $50.24 | 4% |
| 1838 | $1.296 | $48.91 | -4% |
| 1839 | $1.296 | $48.91 | 0% |
| 1840 | $1.296 | $57.88 | 0% |
| 1841 | $1.292 | $57.70 | 0% |
| 1842 | $1.293 | $62.98 | 0% |
| 1843 | $1.292 | $67.87 | 0% |
| 1844 | $1.292 | $66.57 | 0% |
| 1845 | $1.292 | $64.10 | 0% |
| 1846 | $1.292 | $59.67 | 0% |
| 1847 | $1.292 | $59.67 | 0% |
| 1848 | $1.292 | $67.86 | 0% |
| 1849 | $1.292 | $64.10 | 0% |
| 1850 | $1.292 | $67.86 | 0% |
| 1851 | $1.292 | $57.69 | 0% |
| 1852 | $1.292 | $57.69 | 0% |
| 1853 | $1.292 | $54.08 | 0% |
| 1854 | $1.292 | $54.08 | 0% |
| 1855 | $1.292 | $51.66 | 0% |
| 1856 | $1.292 | $50.90 | 0% |
| 1857 | $1.294 | $49.53 | 0% |
| 1858 | $1.292 | $50.16 | 0% |
| 1859 | $1.292 | $54.95 | 0% |
| 1860 | $1.292 | $56.75 | 0% |
| 1861 | $1.292 | $54.95 | 0% |
| 1862 | $1.709 | $66.35 | 24% |
| 1863 | $1.952 | $67.05 | 12% |
| 1864 | $2.939 | $82.89 | 34% |
| 1865 | $1.889 | $49.61 | -56% |
| 1866 | $1.766 | $45.94 | -7% |
| 1867 | $1.741 | $45.73 | -1% |
| 1868 | $1.747 | $47.75 | 0% |
| 1869 | $1.569 | $44.25 | -11% |
| 1870 | $1.430 | $42.10 | -10% |
| 1871 | $1.412 | $42.50 | -1% |
| 1872 | $1.449 | $43.13 | 3% |
| 1873 | $1.421 | $43.26 | -2% |
| 1874 | $1.411 | $42.95 | -1% |
| 1875 | $1.394 | $44.48 | -1% |
| 1876 | $1.315 | $43.55 | -6% |
| 1877 | $1.212 | $42.85 | -8% |
| 1878 | $1.100 | $41.71 | -10% |
| 1879 | $1.144 | $40.45 | 4% |
| 1880 | $1.116 | $37.92 | -3% |
| 1881 | $1.129 | $36.47 | 1% |
| 1882 | $1.099 | $36.40 | -3% |
| 1883 | $1.110 | $37.72 | 1% |
| 1884 | $1.084 | $38.33 | -2% |
| 1885 | $1.032 | $36.99 | -5% |
| 1886 | $1.006 | $36.06 | -3% |
| 1887 | $0.970 | $33.84 | -4% |
| 1888 | $0.936 | $32.66 | -4% |
| 1889 | $0.959 | $33.91 | 2% |
| 1890 | $1.056 | $36.84 | 9% |
| 1891 | $0.956 | $33.35 | -10% |
| 1892 | $0.840 | $29.70 | -14% |
| 1893 | $0.703 | $24.86 | -19% |
| 1894 | $0.615 | $22.35 | -14% |
| 1895 | $0.677 | $24.95 | 9% |
| 1896 | $0.664 | $24.47 | -2% |
| 1897 | $0.590 | $21.74 | -13% |
| 1898 | $0.603 | $21.91 | 2% |
| 1899 | $0.600 | $20.93 | -1% |
| 1900 | $0.648 | $22.31 | 7% |
| 1901 | $0.558 | $18.72 | -16% |
| 1902 | $0.487 | $15.93 | -15% |
| 1903 | $0.560 | $18.32 | 13% |
| 1904 | $0.612 | $19.77 | 8% |
| 1905 | $0.655 | $20.65 | 7% |
| 1906 | $0.696 | $20.93 | 6% |
| 1907 | $0.552 | $16.05 | -26% |
| 1908 | $0.494 | $14.36 | -12% |
| 1909 | $0.529 | $14.57 | 7% |
| 1910 | $0.553 | $15.23 | 4% |
| 1911 | $0.556 | $15.00 | 1% |
| 1912 | $0.640 | $16.74 | 13% |
| 1913 | $0.584 | $14.97 | -10% |
| 1914 | $0.503 | $12.77 | -16% |
| 1915 | $0.561 | $14.10 | 10% |
| 1916 | $0.758 | $17.66 | 26% |
| 1917 | $0.899 | $17.84 | 16% |
| 1918 | $1.019 | $17.14 | 12% |
| 1919 | $1.336 | $19.60 | 24% |
| 1920 | $0.655 | $8.31 | -104% |
| 1921 | $0.663 | $9.40 | 1% |
| 1922 | $0.643 | $9.71 | -3% |
| 1923 | $0.650 | $9.64 | 1% |
| 1924 | $0.692 | $10.27 | 6% |
| 1925 | $0.692 | $10.04 | 0% |
| 1926 | $0.538 | $7.72 | -29% |
| 1927 | $0.583 | $8.51 | 8% |
| 1928 | $0.577 | $8.57 | -1% |
| 1929 | $0.488 | $7.24 | -18% |
| 1930 | $0.330 | $5.01 | -48% |
| 1931 | $0.304 | $5.08 | -9% |
| 1932 | $0.254 | $4.71 | -20% |
| 1933 | $0.437 | $8.53 | 42% |
| 1934 | $0.544 | $10.30 | 20% |
| 1935 | $0.584 | $10.82 | 7% |
| 1936 | $0.454 | $8.29 | -29% |
| 1937 | $0.438 | $7.72 | -4% |
| 1938 | $0.428 | $7.71 | -2% |
| 1939 | $0.350 | $6.39 | -22% |
| 1940 | $0.348 | $6.31 | -1% |
| 1941 | $0.351 | $6.06 | 1% |
| 1942 | $0.448 | $6.98 | 22% |
| 1943 | $0.448 | $6.57 | 0% |
| 1944 | $0.448 | $6.47 | 0% |
| 1945 | $0.708 | $9.99 | 37% |
| 1946 | $0.867 | $11.29 | 18% |
| 1947 | $0.746 | $8.49 | -16% |
| 1948 | $0.700 | $7.37 | -7% |
| 1949 | $0.733 | $7.81 | 5% |
| 1950 | $0.800 | $8.42 | 8% |
| 1951 | $0.880 | $8.58 | 9% |
| 1952 | $0.833 | $7.97 | -6% |
| 1953 | $0.853 | $8.10 | 2% |
| 1954 | $0.853 | $8.04 | 0% |
| 1955 | $0.905 | $8.57 | 6% |
| 1956 | $0.914 | $8.53 | 1% |
| 1957 | $0.898 | $8.11 | -2% |
| 1958 | $0.899 | $7.90 | 0% |
| 1959 | $0.914 | $7.97 | 2% |
| 1960 | $0.914 | $7.84 | 0% |
| 1961 | $1.033 | $8.77 | 12% |
| 1962 | $1.199 | $10.08 | 14% |
| 1963 | $1.293 | $10.73 | 7% |
| 1964 | $1.293 | $10.59 | 0% |
| 1965 | $1.293 | $10.43 | 0% |
| 1966 | $1.293 | $10.13 | 0% |
| 1967 | $2.060 | $15.66 | 37% |
| 1968 | $1.959 | $14.29 | -5% |
| 1969 | $1.807 | $12.49 | -8% |
| 1970 | $1.635 | $10.70 | -11% |
| 1971 | $1.394 | $8.73 | -17% |
| 1972 | $1.976 | $12.00 | 29% |
| 1973 | $3.137 | $17.93 | 37% |
| 1974 | $4.391 | $22.62 | 29% |
| 1975 | $4.085 | $19.29 | -7% |
| 1976 | $4.347 | $19.40 | 6% |
| 1977 | $4.706 | $19.72 | 8% |
| 1978 | $5.930 | $23.09 | 21% |
| 1979 | $21.793 | $76.24 | 73% |
| 1980 | $16.393 | $50.53 | -33% |
| 1981 | $8.432 | $23.56 | -94% |
| 1982 | $10.586 | $27.86 | 20% |
| 1983 | $9.121 | $23.26 | -16% |
| 1984 | $6.694 | $16.37 | -36% |
| 1985 | $5.888 | $13.89 | -14% |
| 1986 | $5.364 | $12.42 | -10% |
| 1987 | $6.790 | $15.18 | 21% |
| 1988 | $6.108 | $13.12 | -11% |
| 1989 | $5.543 | $11.36 | -10% |
| 1990 | $4.068 | $7.91 | -36% |
| 1991 | $3.909 | $7.29 | -4% |
| 1992 | $3.710 | $6.72 | -5% |
| 1993 | $4.968 | $8.74 | 25% |
| 1994 | $4.769 | $8.17 | -4% |
| 1995 | $5.148 | $8.58 | 7% |
| 1996 | $4.730 | $7.66 | -9% |
| 1997 | $5.945 | $9.41 | 20% |
| 1998 | $5.549 | $8.64 | -7% |
| 1999 | $5.218 | $7.95 | -6% |
| 2000 | $4.951 | $7.30 | -5% |
| 2001 | $4.370 | $6.26 | -13% |
| 2002 | $4.600 | $6.49 | 5% |
| 2003 | $4.876 | $6.73 | 6% |
| 2004 | $6.671 | $8.96 | 27% |
| 2005 | $7.316 | $9.50 | 9% |
| 2006 | $11.545 | $14.53 | 37% |
| 2007 | $13.384 | $16.39 | 14% |
| 2008 | $14.989 | $17.68 | 11% |
| 2009 | $14.673 | $17.38 | -2% |
| 2010 | $20.193 | $23.54 | 27% |
| 2011 | $35.119 | $39.67 | 43% |
| 2012 | $31.150 | $34.46 | -13% |
| 2013 | $23.793 | $25.93 | -31% |
| 2014 | $19.078 | $20.47 | -25% |
| 2015 | $15.680 | $16.80 | -22% |
| 2016 | $17.144 | $17.96 | 9% |
| 2017 | $17.045 | $17.45 | -1% |
| 2018 | $17.001 | $17.00 | 0% |
| 2019 | $16.22 | ||
| 2020 | $20.69 | ||
| 2021 | $25.14 | ||
| 2022 | $21.76 | $21.76 |
Price History of Silver
As of this writing, the spot price of silver is hovering around $25 per ounce. This is a drop from the all-time high of nearly $50 per ounce in 2011, but it’s also a significant increase from the lows of less than $12 per ounce in 2020. So, what gives? Why has silver seen such volatility?
One factor is the global economic landscape. Silver is often seen as a safe-haven asset, meaning investors turn to it in times of economic uncertainty or instability. The COVID-19 pandemic certainly brought plenty of uncertainty, causing a dip in all assets, including silver, in early 2020. However, as economies began to print currency, silver prices rebounded to new highs.
Another factor is the industrial demand for silver. Unlike gold, which is mostly used for investments and jewelry, silver has many industrial uses, such as in electronics, solar panels, and even medical equipment. When the global economy is booming, demand for silver increases, and so do prices. Conversely, when the economy slows down, demand drops and prices follow suit.
Historically, the ancient Egyptians and Greeks, the Babylonians, and the Roman Empire used it extensively as currency. This continued through the medieval ages in Europe.
By the Industrial Age of the 18th and 19th centuries, the use of paper money was on the rise, and the price of silver was generally stable. From the birth of the US up to its Civil War, its price was $1.30 per ounce. The Civil War caused the price to fluctuate wildly, but afterwards its value declined steeply. During the Great Depression, its price was $0.25 an ounce. It only crossed the $1 per ounce mark in 1960.
The price rose steadily during the 1970s, which culminated in the notorious attempt by the Hunt brothers to corner the silver market. They bought physical bars as well as futures contracts, which were settled on delivery with silver as well. They even borrowed money to expand their investments and exhorted other funds and investors to join the bandwagon. All their efforts caused the price to jump to more than $50 an ounce.
Soon the US government stepped in, and they were able to use methods that thwarted the brothers. Eventually, on March 27, 1980, the price fell from $48.70 to less than $11 an ounce. The day became known as “Silver Tuesday.”
Silver prices have been relatively stable through the 1980s and 1990s, hovering around $5 per ounce. However, nearing the financial crisis of the early 2000s, prices began to climb, eventually peaking at nearly $50 per ounce in 2011 before returning to the $10–15 range. This was largely due to the 2008 Recession, the resulting economic uncertainty and currency expansion, as well as increased demand for silver in industrial applications.
Since then, the price of silver has steadily gone up, with peaks and valleys caused by things like economic instability and industrial demand. The way governments add and take away money from the market can cause volatility, but silver remains a popular investment for people who want a tangible asset that has a history of keeping its value.
Silver as Investment
Compared to gold, silver prices can be very volatile. But you can invest in the metal in several ways.
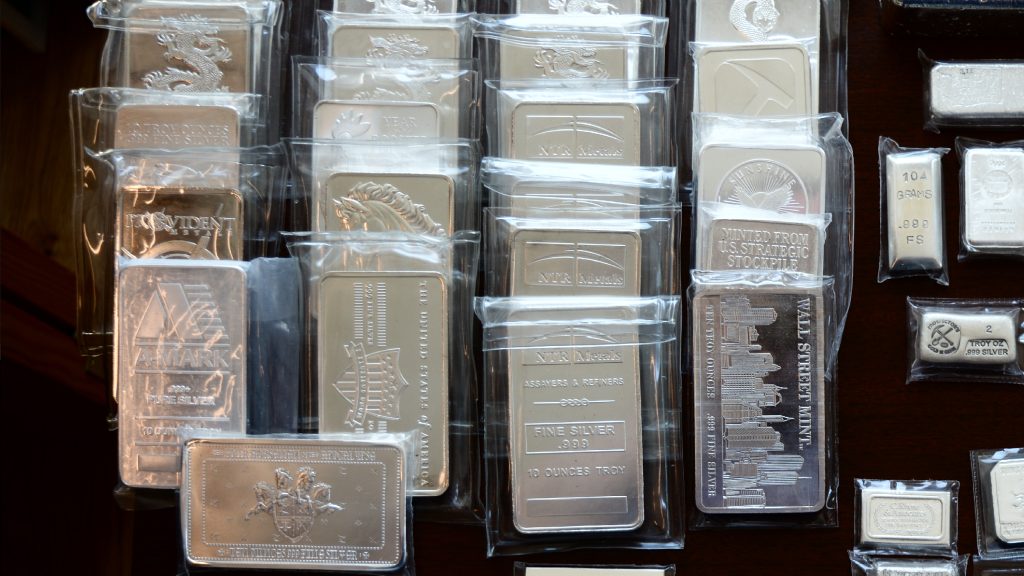
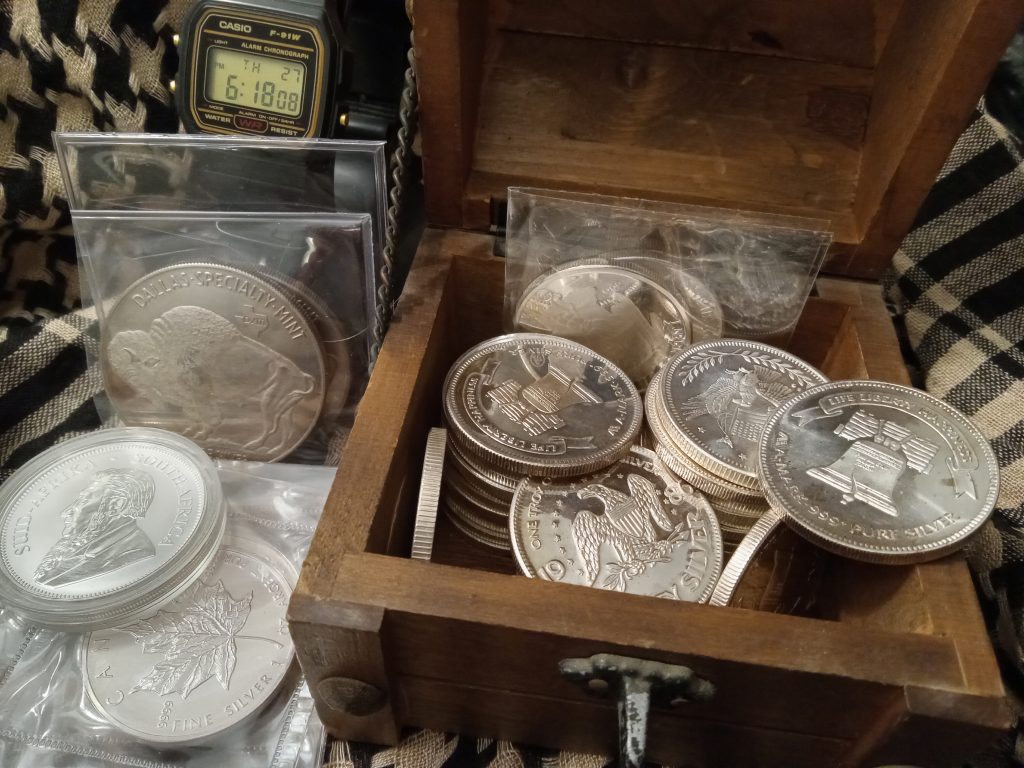
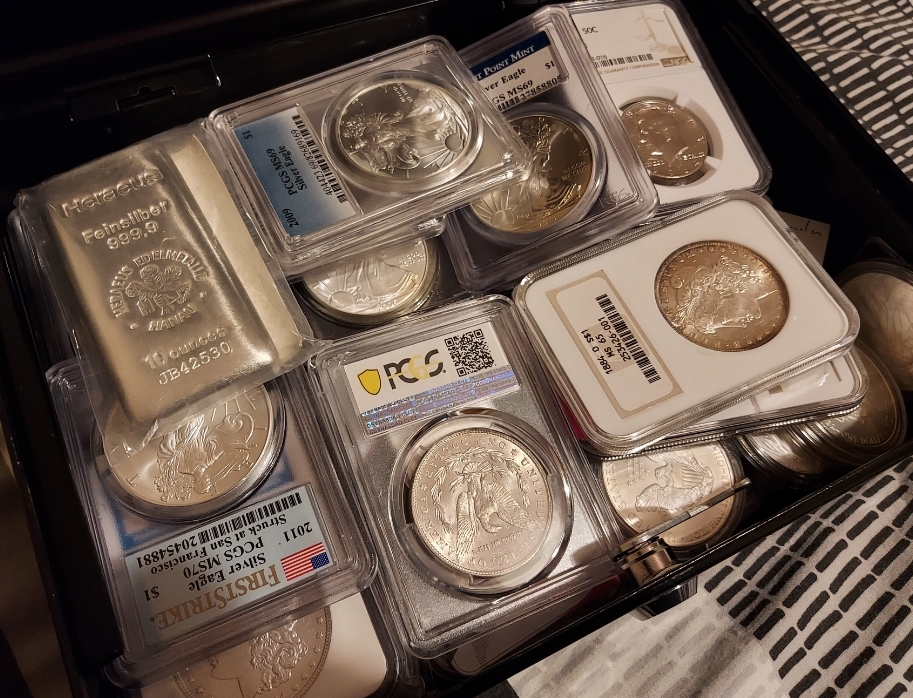
- You can buy it in physical form, as bars and coins. They’re just plain cool to look at and hold in your hand! When it comes to purchasing physical silver, you have a few options. You can buy from a reputable dealer, either online or in person, or you can buy from an individual seller. If you choose the latter option, be sure to do your research and only buy from someone with a good reputation to avoid purchasing fake silver. It has enough value in these bars and coins to make storage fees worthwhile. You can also buy certificates of ownership without having to transfer the metal physically. You can also buy accounts in Swiss banks, which you can then trade. In this form, it’s a hedge against inflation, especially in these times when many governments feel free to print money at will.
- There are also exchange-traded funds (ETFs) that allow you to invest in silver without physically owning it, but these can be riskier and don’t offer the same level of security as physical assets.
- You can buy futures contracts in the COMEX subsidiary of the New York Mercantile Exchange.
- Or you can trade in the stocks of mining companies, which usually mine many types of metal instead of a single metal alone.
So, what can we expect from silver prices in the future? As with any investment, it’s impossible to predict with certainty. However, many analysts believe that silver prices could continue to rise in the coming years. This is due in part to increased demand for silver in green technologies like solar panels and electric vehicles, as well as ongoing economic uncertainty and inflation concerns.
Of course, as with any investment, it’s important to do your research and consider your personal financial goals and risk tolerance before diving into the world of silver. But with a little bit of knowledge and a bit of luck, investing in silver could be a smart move if you are looking for a stable and valuable asset to add to your portfolio.
Purposes Used For Silver
Most people are somewhat aware of the use of silver as a financial tool for investment. And many also know that it has its place in jewelry. About 10% of all silver is used for coins, jewelry, and other types of art.
For the longest time, almost half of the silver in the US went into making photographic film, but that declined with the rise of digital photography. But it is still used extensively in various electrical and electronic devices because it is the most effective metal at conducting electricity.